Let’s not forget about the “science arm” of our astronomical ventures! It’s not always about pretty pictures of galactic and extragalactic objects (although a lot of it is about that!) . The Talavera Space Hut as it is affectionally termed houses a C14 telescope and Lhires (which stands for Littrow, high resolution) spectrograph. I am doing a fair amount of spectroscopy and many earlier posts have been devoted to this so you can just do a search here and that will turn up a lot of info! You can see the equipment and set up here.
At any rate the coolest thing about amateur astronomical spectroscopy in my opinion is that it is very relevant to current astrophysics and astrophysical research. Most of our understanding of stars, how they work and the large scale structure of the universe comes from analysis of spectra of stars and other objects. High resolution spectroscopy which is what I am doing, focuses on stars and stellar systems. Professional astronomers need people like you and me to help them with observations! They do not have the daily access to equipment that we do and while it may be hard to believe that modest amateur equipment such as what we use can make such a contribution, all you have to do is get on a few internet spectroscopy groups and almost every week there will be a “news flash”, “bulletin” or some other announcement regarding a current observation being done by a professional astronomer somewhere requesting additional observations from you and me!
Recently a request for observations of Rigel, a blue supergiant star in Orion, came out of the Cote d’Azur Observatory in France. This is an internationally recognized center for research in astronomy.Their ongoing project involves luminous BA-type supergiants which can be observed in distant galaxies and are potential accurate distance indicators. However, the impact of the variability of the stellar winds on the distance determination remains poorly understood. By monitoring high resolution spectra of these stars over time they hope to understand this variability better. Now while I do have an undergraduate astronomy degree, I am not going to break down the quantum physical intricacies of subtle changes in the morphology of spectral absorption lines, at least not today. But what I can do is obtain a high resolution spectrum of Rigel to contribute to their ongoing research. That is what I did. Before showing that just a couple of definitions to clear up. Firstly is “high resolution”. What is that? Resolution refers to the smallest detail discernible in a spectrum obtained with the particular spectrograph. For my set up we are looking at a small region of the spectrum, on the order of about 100 angstroms (The entire visible spectrum spans about 3500 angstroms) Resolution is typically designated by the “R” value where R is the ratio of the wavelength considered divided by the smallest change visible. In the amateur community low resolution is typically in the R= 100 to 300 range. High resolution might be anything greater than 10,000. Professionals may be up to even 100,000 with some of the setups they are using. Lhires spectrograph which is what I am using is typically in the 16-19000 range. Most of the observations of stars and stellar systems require high resolution data mainly because the phenomena are reflected in very small wavelength changes, on the order of a few tenths of an angstrom. Low resolution data are ideal for analysis of distant objects such as galaxies, supernovae and the like.
Now on to Rigel. This is a familiar bright blue star in the constellation Orion. About zero magnitude, it is a spectral class B8Ia. Spectral classification is a fascinating subject in and of itself but in a “nutshell” from your high school astronomy class the letter classification sequence of O, B, A, F,G, K, M, with numeric sub-classifications from 0-9, that was established at the beginning of the 20th century still holds, of course with some additions and modifications. So generally speaking it goes from the brightest, most luminous “O” stars down to the dimmer “M” stars. Numbers increasing from 0-9 indicate decreasing surface temperatures. Our Sun is in the middle at G2. Type B stars are characterized spectroscopically by their strong absorption lines of neutral Helium. This is around 6678 angstroms. These tend to decrease in intensity from B0-B9. There is also a hydrogen alpha absorption line which is where the researchers were observing but this line is not as strong as in the stellar A class. Hydrogen alpha strength typically increases from B0-B9. However the H-alpha line for Rigel is very weird! It has variable emission components in it (see below). Based on observations of Rigel’s variable H-alpha line, the star is estimated to lose mass at a rate of (1.5 ± 0.4) × 10−7 solar masses per year, or 10 million times faster than the Sun!
My observation was done this month and consisted of about 1-2 hours total imaging time, including calibration frames and flats. 12 45 second spectra were obtained and processed.
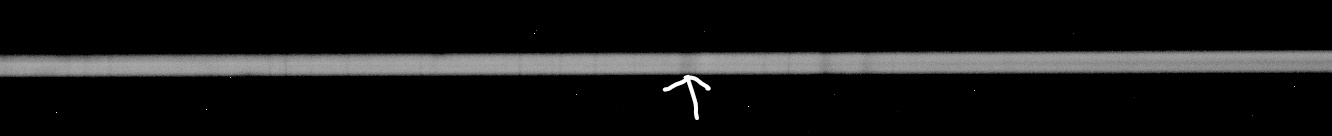
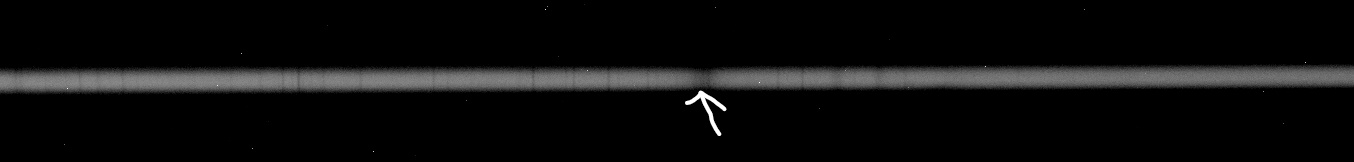
Single raw 45 second spectrum of Rigel. Arrow points to the hydrogen alpha absorption line. It has a “washed out” appearance due to the fact that there is some component of emission occurring at this wavelength, not just absorption. At this resolution there are a lot of lines visible but many of the others are likely from water in our atmosphere.
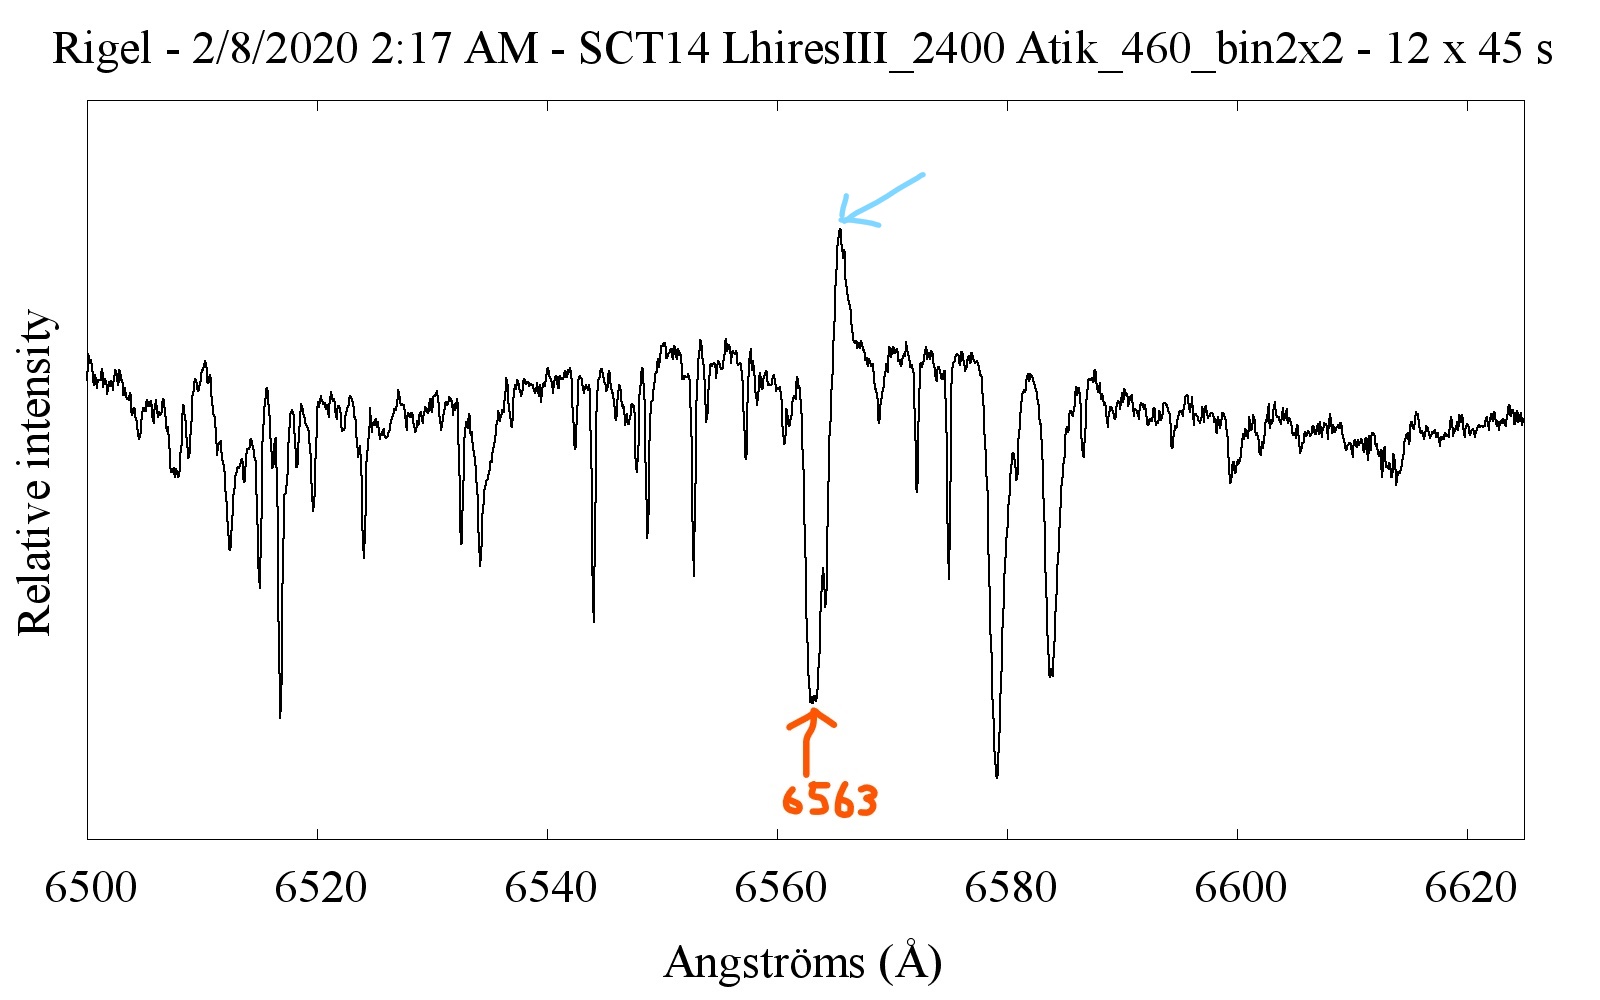
The spectrum of Rigel is shown here. So as it turns out, Rigel is not “just” a type B star. It is a variable star and is actually part of a multistar system. The red arrow points to the H alpha line. The blue arrow points to what is an emission component at this wavelength. You can see how the relative intensity is increasing there!. This is characteristic of emission lines. Emission activity in the H-alpha line of the so-called BA supergiants such as Rigel (B8Ia) is indicative of the presence of some type of mass ejection from the star.
The peculiar appearance of the H-alpha line with emission feature on the red side of the line and absorption on the blue side is called a “P Cygni” profile. This is named after the prototypical variable star in the constellation Cygnus. P Cygni gives its name to a type of spectroscopic feature , again, where the presence of both absorption and emission in the profile of the same spectral line indicates the existence of a gaseous envelope expanding away from the star. The emission line arises from a dense stellar wind near to the star, while the blue-shifted absorption lobe is created where the radiation passes through circumstellar material rapidly expanding in the direction of the observer. These profiles are useful in the study of stellar winds in many types of stars.
The second item on the agenda at Talavera was not directed at any particular research but was a task I had to do in order to be able to submit spectra to the database at the AAVSO, American Association of Variable Star Observers. The AAVSO is probably the largest repository for professional-amateur collaboration in the world. We regularly get bulletins and notices of ongoing research requiring amateur assistance. If you are considering spectroscopy, AAVSO membership is a must! At any rate to become a “legitimate observer” you have to submit a spectrum from a list of their “standard stars” and have it validated. I chose epsilon Canis Major, also known as Adhara, for the exercise. This is a more “normal” B type star, actually a B2. The interesting thing is that you can see the H alpha line is stronger here for this star compared to Rigel which is a later B type star (B8) and so the H alpha absorption strength should be less. This is because the line in Rigel has emission characteristics as described earlier.
This is a 1 minute raw exposure for the star Epsilon Canis Major. Even in this raw image you can see the hydrogen alpha line is way darker than the previous line seen for Rigel, when it should be the opposite!
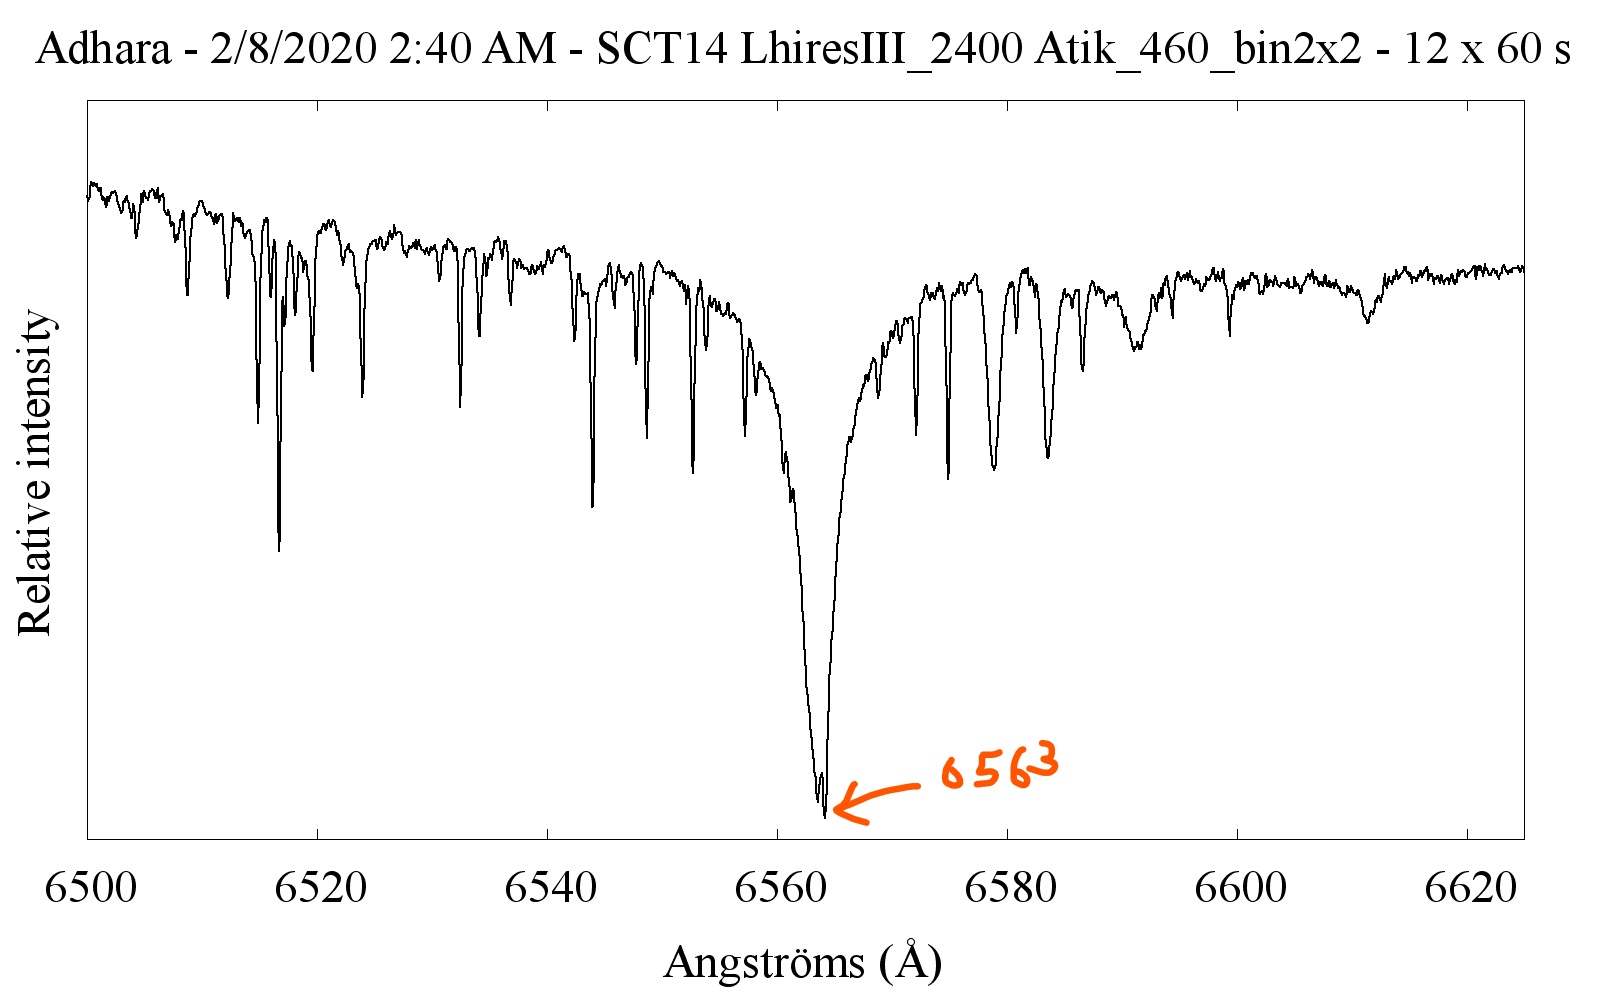
This is a pretty “normal” looking hydrogen alpha absorption line for the star Adhara or Epsilon CMaj. Note it is pretty symmetric in both the “blue” arm on the left and the “red” arm on the right. Compare this to the emission feature on the red side of Rigel’s H-alpha line.
Ok folks. That’s the February news from the Talavera Space Hut. I guess it’s enough astrophysics for 1 day!
Thanks for reading!
Dr Dave