Last February we held a global spectroscopy conference here in Las Cruces NM during which I was supposed to run a live spectroscopy session at night for about 100+ attendees! Unfortunately as bad luck would have it, it was a rare cloudy night on that night. As a result that demonstration never occurred and for several attendees, there was no basic introduction to setting up and using really any spectrograph. That is why I decided to create this page. If you are an amateur astronomer who perhaps was at that conference and was disappointed there was no very basic how to information, or if you are an amateur astronomer or astronomy enthusiast who is interested in getting into this growing field of amateur spectroscopy but is apprehensive about the set up and equipment, this blog page is for you. Really the goal of this is to have you come away, after going through it, with the feeling that “gee, I don’t think it’s nearly as hard as I thought. I really think I can do it”. If you are able to do that, then this was a success. Please look through the images at the end which illustrate the points discussed below.
We are not going to talk about any of the physics behind spectroscopy, how spectrographs work, quantum physics or any of that. This is all about what you need and how you do it. That’s it. Then hopefully you can go from there. If you have any experience with astroimaging or photometry or even using a telescope to find objects in space, I think you will be surprised at how straightforward the basic spectrum acquisition is. The challenge is interpreting the physics of your results. And to be fair, the further you go with this certainly the more challenging it will become! That’s the exciting part!
At the conference early in the year I got a sense that many folks were puzzled about what spectrograph to start with. There are many choices for sure. This discusses mainly the L hires spectrograph. That is for what is called “high resolution”. Basically there is high resolution and “low” resolution. Your high resolution spectrographs include the L hires iii and Eshel. There may be others I don’t know about. Lower resolution options include star analyser, Lisa, Alpy etc. Check out the Shelyak website for more details on these but do not get intimidated by the words “high resolution”. All this means is that you are looking at a very small, maybe 50-100 angstrom region of the spectrum at a time. This is great for analyzing small changes in absorption or emission lines in single stars or stellar systems such as binaries. The typical number that is used for resolution is “R”. What that is, is a measure of how small a change in wavelength is visible with your setup and is calculated by the equation: wavelength/ change in wavelength. So for example if you take a spectrum with Lhires, process it and get an R value of around 18000, the approximate practical limit of resolution for Lhires, that means you can see wavelength changes of around 0.35 Angstroms! With such small changes you will be able to measure radial velocities of spectroscopic binary star constituents and calculate orbital periods of these systems as well as other parameters. Detection of extrasolar planets is also possible. Remember though, increasing the resolution will limit your magnitude capability to perhaps 8-9 tops. Lower resolution setups such as Alpy, Lisa etc (R value around 3000 or so) will enable you to see the entire spectrum at one time and also make accessible dim targets such as galaxies, supernovae and planetary nebulae. So it really depends on your interests but the point is don’t be afraid to start with high resolution equipment. Of course it will cost more but not necessarily prohibitively more in my opinion and I hope after going through this you will not exclude the high resolution option because of your preconceived ideas regarding it being too complex or difficult to do!
As I was commenting, there is no processing per se in this discussion but I do want to go over in a little more detail the steps on using the processing software for the purpose of focusing the spectrograph. First download the software here. Once you install it you will need to tell it where the folder is to access your files.
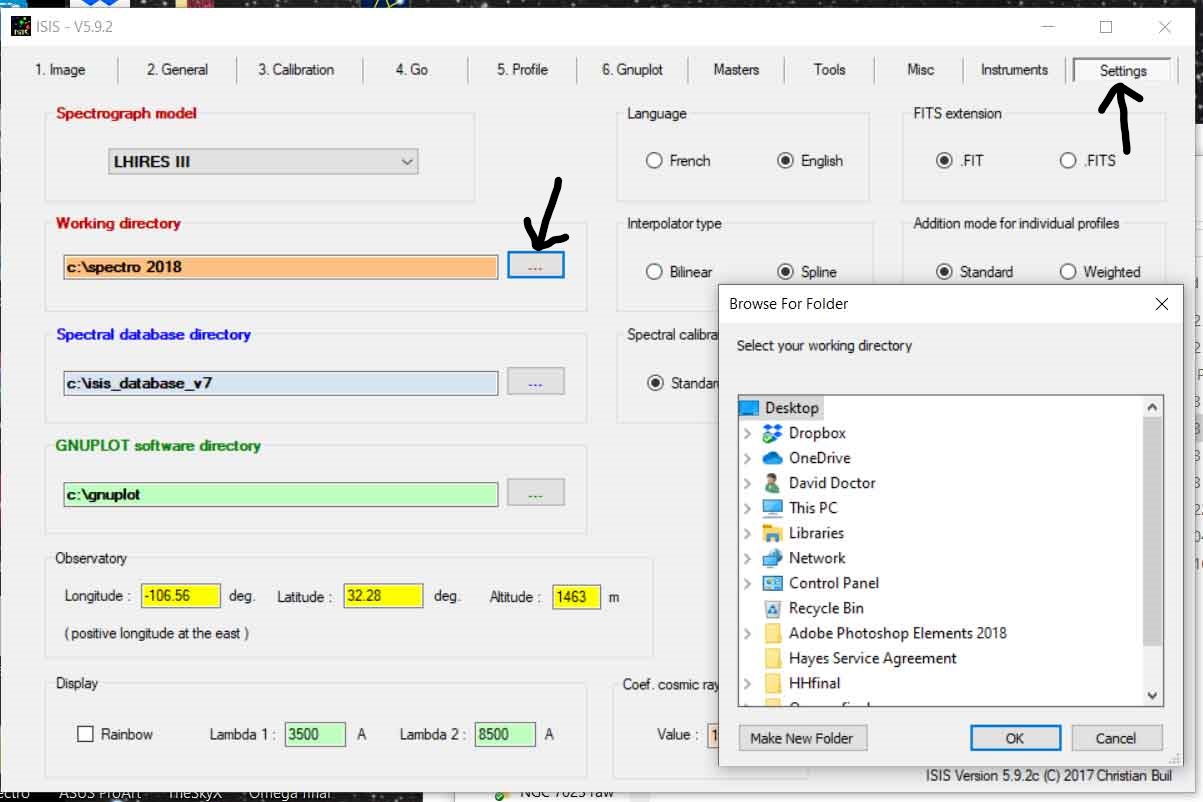
Open the program and click on the settings tab at the far right. Then click on the box under the black arrow next to working directory and select the folder where the files are going to be saved. As mentioned I recommend a folder right in the C directory with no subfolders
I have found it works way better to have the folder in your C drive directory as I point out in the videos. Once you have instructed the software where the folder is located you will save your calibration lamp images there so you can use it to check your focusing efforts.
Here is again a list of the required items to do high resolution spectroscopy:
1) A telescope of course. The L hires requires the optics to be in the f/10- f/12 range for best results. It looks to me like many are using Celestron SCTs or you could consider a used GSO RC scope. I’ve seen that as well.
2) L hires iii. This is way easier to use and less expensive than Eshel. I have seen used L hires spectrographs on Amart for 1500-2000 US
3) 2 cameras. Atik cameras (314L, 400 series- used condition around 1500 US) are preferred for your main acquisition camera because of their red sensitivity. They are also light weight and the adaptors are standard with the Lhires. That makes it way easier because of the requirement for that spectrograph to sensor distance to be exact within 1-2mm (see diagram below). However I am sure there are many other possibilities. Your guide camera can be just about anything but remember your guider is for both your target object and for guiding. I chose ZWO 174M because the sensor is pretty big for a guider (1900+ x 1200+ pixels) and it’s only 300 US or so used.
4) Mount- can be anything but the more accurate your mount, the easier it will be to image dimmer targets
5) AC adaptor for the calibration lamp. It requires 12V power. You could certainly use DC if desired.
6) Laptop obviously with camera control software and planetarium program. Your choice!
Here is a list of the steps:
1) Make sure if you don’t have a copy of the Lhires manual you should download here and look at the steps regarding observing the Sun with an eyepiece. This is a must before you do anything else. Just take the spectrograph outdoors (no telescope yet!) Use the micrometer on the spectrograph (That tall silver thing with the lines and numbers on it) Get comfortable turning the micrometer and scrolling through the spectrum of the sun in living color. You should observe the light coming through the slit which is like a tiny sliver of light on one end (This is called the zero order). Then as you turn the micrometer knob you will see the colors and a thousand black lines. These are the absorption lines. I had no idea there were so many! You will go from the blue to yellow and then finally to red as you keep scrolling. When you get to H alpha you will know it because it is this super thick black line that jumps out at you.
2) Once you are pretty sure you have located the H alpha line be certain to write down the micrometer numbers. Then cover the telescope end of the spectrograph and turn on your calibration lamp. If you have correctly identified the H alpha region you should see red emission lines. At least 3 or 4 in the field. Then you are ready to proceed!
3) Attach the Lhires to the telescope directly. Make sure the collar is as tight as possible. The nice thing about using the Celestrons is that the connections are standard and you don’t need any weird adaptors for those.
4) Attach your camera to the lower camera port using your adaptor and pay very close attention to the spectrograph to camera distance as per this diagram.
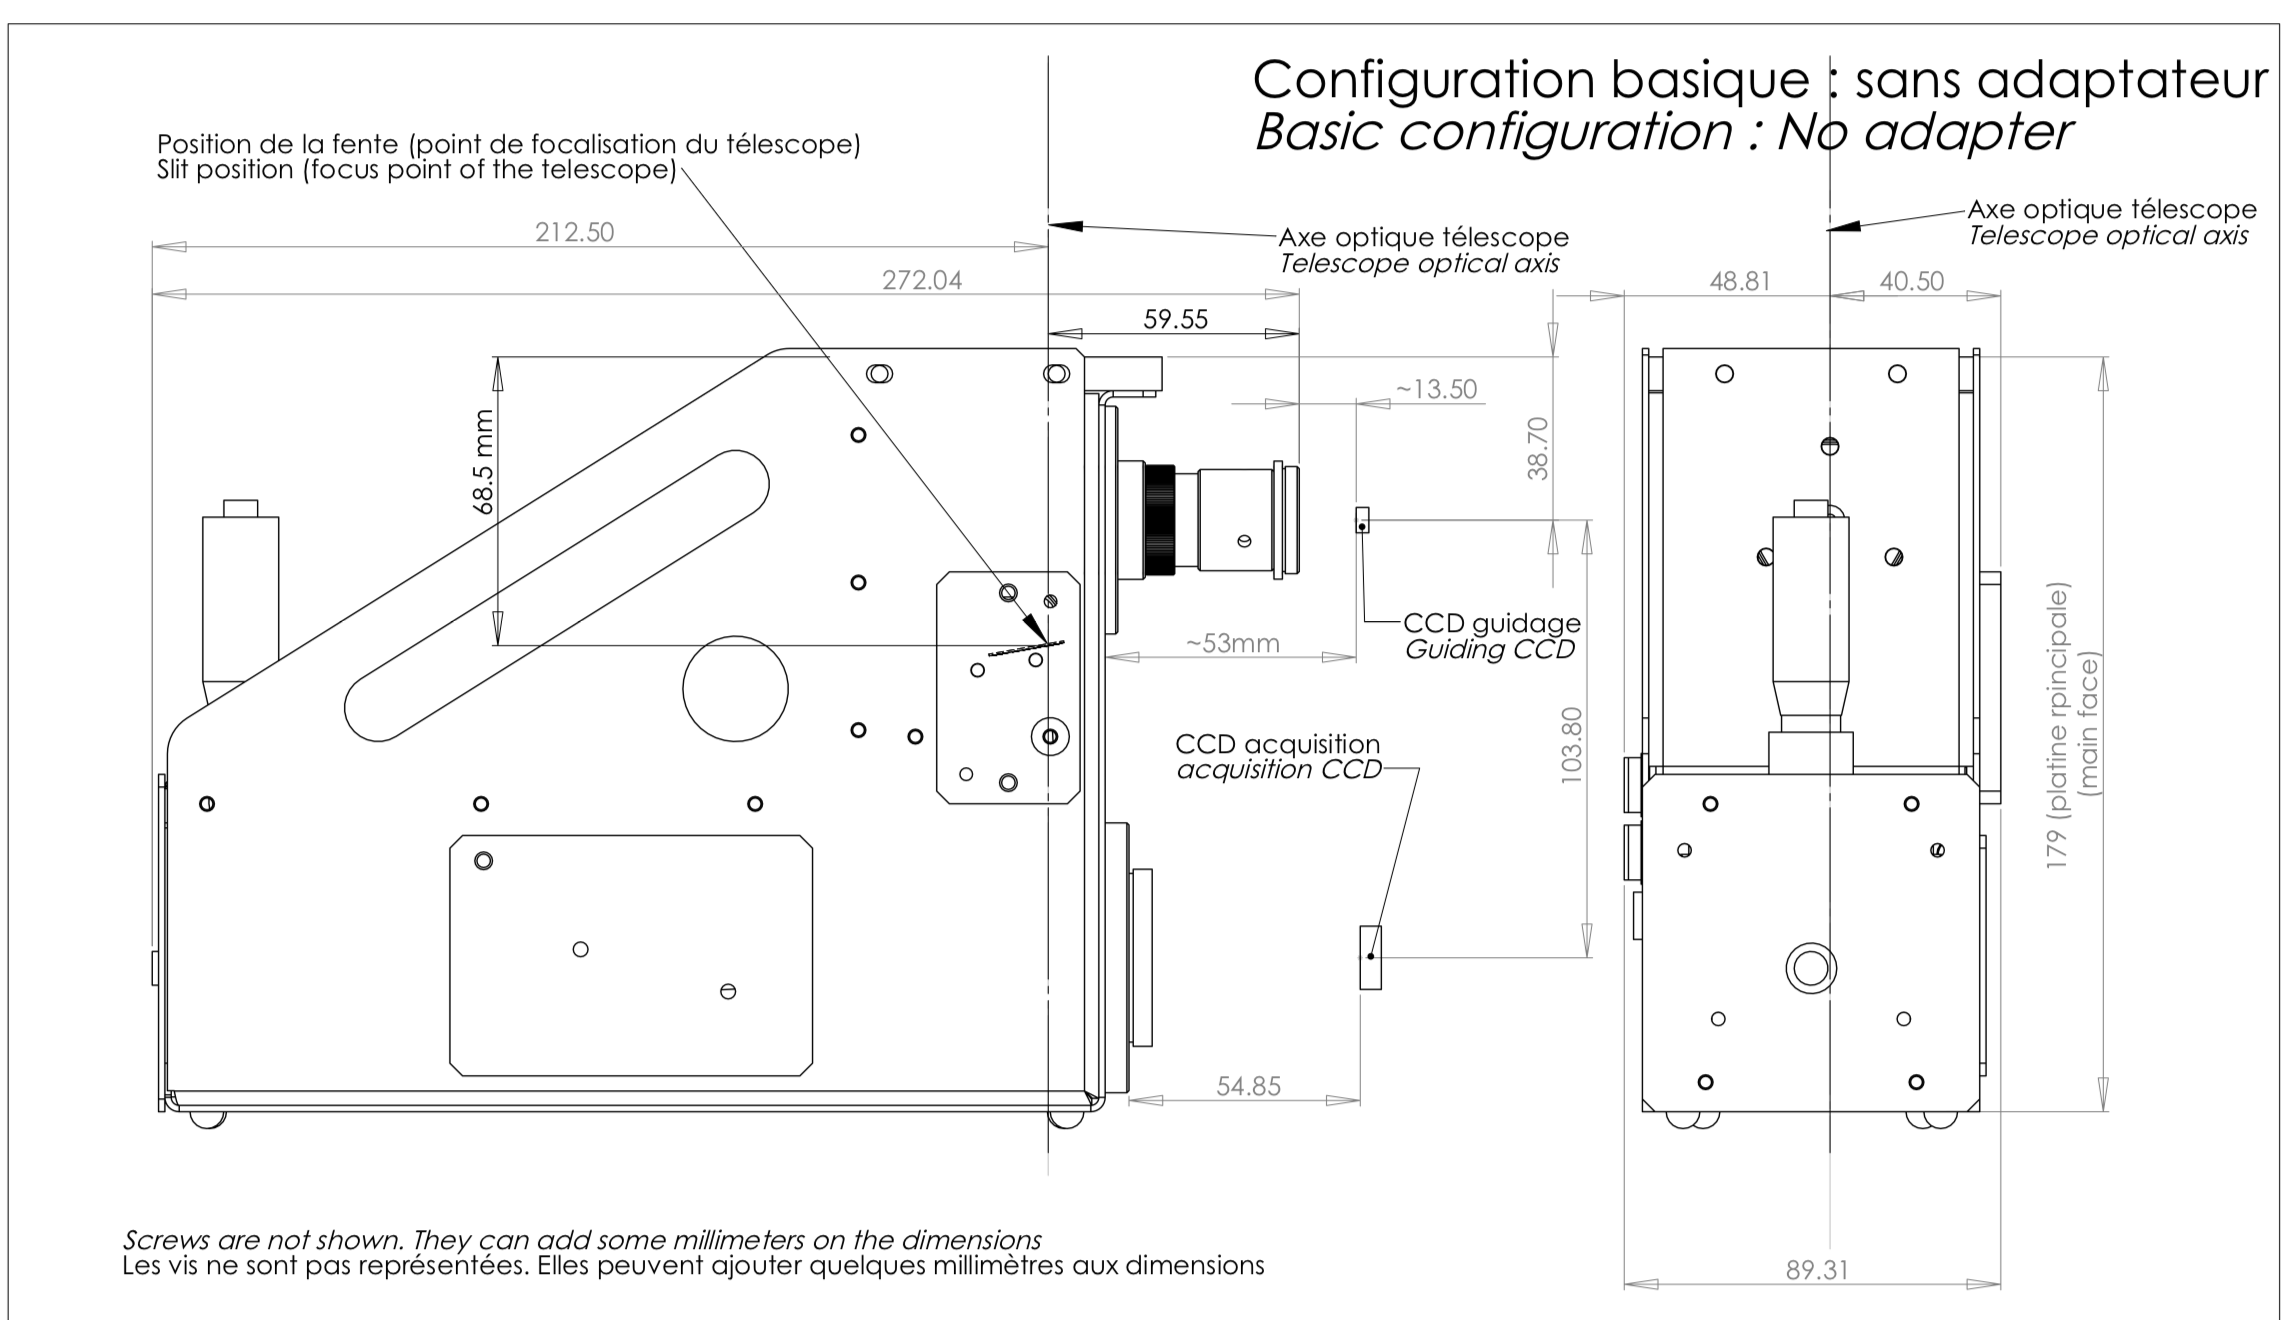
Technical drawing for Lhires showing the optimal distance to the guider ccd , 53mm and main camera, 54.85. Subtract backfocus of ASI 174 camera which is 6.5 and that leaves 46.5mm distance between the spectrograph base and the camera face. I was at about 45mm for that so we were good there and similar calculation for the main camera backfocus ,13.5 mm and that left 41-42mm as the difference . Just need to make sure both distances are no more than 1-2mm off the mark
Don’t worry about how the spectrograph is oriented relative to the scope. That doesn’t matter. Just make it convenient to get to the cameras, spectrograph and lamp switches.
5) Focus the spectrograph using the focusing ring inside . (See images at the bottom of this page) First slew your scope to an area where you can easily get to the spectrograph. DO THIS DURING THE DAY! You can alternatively do this indoors but my experience is you will need to repeat it outdoors because of the temperature change. Cover the telescope, then turn on the calibration lamp. Take an image say 3-4 seconds. Save the image to your folder you are using (see above). Use the software to measure your full width half max value (FWHM) by going to the image tab, opening the test image and then take your mouse and draw a tiny box around the center of the middle calibration line, just an eighth of an inch or so. Then click on the tab on the right that reads “FWHM”. Your target result will be something in the 2-3 range. If it’s way off don’t worry. Just keep adjusting the doublet inside the spectrograph until you get the desired result. Now notice the orientation of the calibration lines. Make sure they are longitudinally oriented. Check that the lines you see are grouped as shown in this tutorial (scroll down and you will see them labeled with angstrom values) .If the lines are going sideways or oblique they are not oriented properly and you will need to rotate your camera until they are vertically oriented. Make sure you see the 2 calibration lines closer together on the left and the one line by itself on the right. If that is reversed then your camera is upside down. Remember blue is on the left and red on the right. If you turn your micrometer COUNTERCLOCKWISE, the calibration lines should move LEFT. If that is true, you are good to go!
6) Once you have your camera attached and spectrograph focused to 2-3 FWHM you are ready to go to the guide camera
7) Check the same spec diagram above you used for the camera to optimize the guider distance. This also has to be very accurate. The guide mount is weird. It’s a “C” mount. Video cams such as ZWO, Titan etc will have available adaptors that do not increase backfocus. Once your backfocus is correct, take an image DURING THE DAY. Same considerations there. Put the telescope cover on. Make sure the calibration lamps are off. Take a few second exposure and you will see a white image with a black line hopefully near the center. Rotate the camera until the black line passes through the center of your image field (use the reticle on your capture program). If you have the correct backfocus set up (see diagram above) the line will be the thinnest possible (around 2 pixels) There is no focuser for this. That might not be obvious. You have to have the backfocus correct for the black line (image of the slit) to be right.
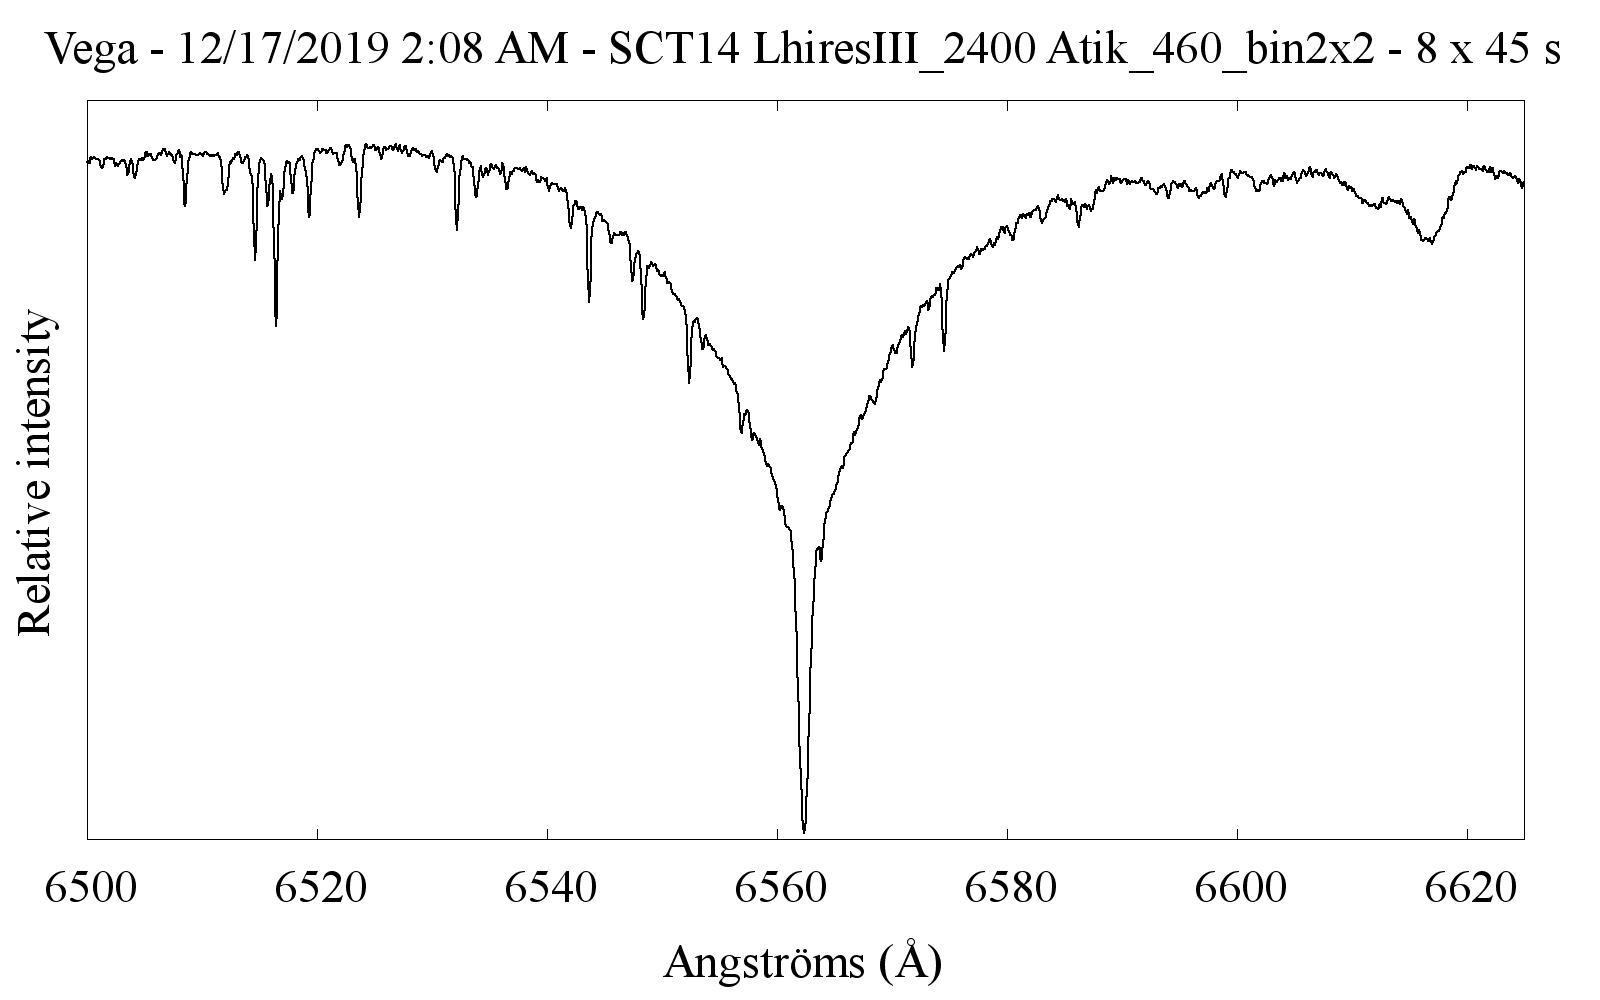
8) Once you have the guider set up as above, you are ready to go to night time work! Now we are assuming you have the telescope polar aligned, collimated and you can point to objects with decent accuracy. “Decent” is hard to quantify because some folks may be able to find the target easier than others if it’s outside the field of view but the dimmer the object the more difficult that is going to get so you will want to optimize pointing capability whatever that means for your case. Always start with a spectral type A star. This has a strong h-alpha absorption line. In this demonstration we used Vega which is super bright and this makes the set up much easier. Slew the telescope to the star. Take an exposure with your guide camera, a second or 2. Once the star is in the field, place the star over the slit line so the line bisects the star i.e the star is centered over the slit. The experts say you have to be within a pixel or 2 of center. My experience tells me the eye is an excellent judge of symmetry and you will get a “feel” for that with experience. Now for this demonstration we did not guide. Vega is so bright that exposure times are going to be short. We used 30 sec exposures. How you determine exposure is you want no more than 80% saturation of the sensor. You can check in your camera capture program the max ADU count to make sure it’s not too high. Then take an image and presto- there is your spectrum! You may have to make adjustments to camera position and micrometer as shown in the video. Once you have a spectrum correctly aligned horizontally close to the center of your sensor then you are ready to do a complete project! Here is the work flow for a project looking at H-alpha line of star X:
- Go to a bright Type A star and take 8-10 images of that. This is your calibration star.
- Take 1 calibration lamp image
- Go to your target star and take as many images as you can over 1-2 hours
- Take your flat images
Finally the result of a quick session on Vega, 8 x 45 sec exposures. Note we did not do any guiding on this and the resolution was 16000+ which is great. The trick will be dimmer targets!
I hope this was helpful to you.
Thanks for reading!
DrDave


